A Review of the Markets in the Post-GFC Era
The coronavirus pandemic marked the end of the Post-GFC era, and the beginning of a new one. A review of the defining characteristics of the financial markets in the prior cycle is helpful if we are to make sense of the current state of the markets, and begin forming an idea of what’s in store for the years to come.
***
Having spent my entire career in and around the financial markets, it’s somewhat embarrassing to admit that I’ve never invested my money in any concerted manner. My only “investment” was buying some Bitcoin in 2016 (which has performed very well), but aside from that I’ve never made a single other real investment. I’ve never bought a stock, never inevested in a bond, don’t own real estate, etc.
I do however follow the financial markets closely (they influence my job and are more generally something that interests me intellectually) and so I’ve always had opinions about investment strategies. But a series of perhaps valid reasons1, or arguably lazy excuses, have always held me back from acting upon them. Whatever the case, for a few years a voice in the back of my mind has been telling me that this is slightly intellectually dishonest of me, and so I decided to make one of my new year’s resolutions finally putting my money where my mouth is and putting my savings “to work” as they say.
So a few days ago I opened a brokerage account on the advice of a friend, and with a metaphorical blank sheet of paper in front of me started thinking about how to go about the task. Fairly quickly though I realized I had a problem: I could not have picked a more confusing and complicated time to invest. With the world rocked by the effects of the coronavirus outbreak, financial markets have been on a wild rollercoaster ride, with huge swings and at times incomprehensible moves having characterised the last nine months. But beyond this, we are witnessing deep and profound shifts in economic conditions and policy that may mean that we are on the cusp of a “new normal”.
The impetus of this post (and likely future posts) thus stems from my need to make sense of what has been happening, with a view to interpreting and assessing what may be in store for the future.
N.B. My benchmark audience for this article are my parents. In the times we’re in, and given they are now retired and have most of their savings invested, our dinner conversations have often revolve around the issues discussed in this post. I’m sure they would be pleased to know that I consider them smart and educated people, but I’m also confident they would not be offended when I say that I do not consider them to be particularly knowledgeable about financial markets. As such, this post may at times come across as simplistic or rudimentary to certain readers. But writing this way is also selfishly motivated. When trying to understand complex and multifaceted issues, I find it usually helps to go “back to basics”.
A Decade in Which Financial Markets Ripped Up the Rulebook
I graduated from university and entered the workforce in 2007. My first job was with Barclays’ investment banking arm in London, at the time called Barclays Capital. I had been hired into the Leveraged Finance division, the team that dealt with debt issuance (loans or bonds) for transactions that were on the more extreme end of the risk spectrum: High Yield bonds (otherwise known as “Junk” bonds), Leveraged Buyouts, etc.
My timing could not have been more forbidding. I still remember how in the weeks leading up to my start date, my family and I went on vacation to New York. As a fresh-faced graduate about to enter the financial markets I dutifully read the Financial Times every day. It was July, and the papers were nervously covering the Bear Stearns hedge fund implosion and documenting the stock price declines. I remember wondering what it all meant and feeling a sense of concern. Little did I know what was to come.
By all accounts, the Great Financial Crisis (“GFC”) of 2007-2008 was a defining moment in financial, and human history. It was undoubtedly one of the worst financial crises of all time, wiping out more than $2 trillion from the global economy, and leading to the most severe global recession since the Great Depression as well as a series of later inter-related shocks such as the European debt crisis a few years later.
Confronted with the effects of a shock of such monstrous proportions, policy makers around the world enacted a series of groundbreaking interventions. Historic and venerable financial institutions were bailed out or effectively nationalized, and massive stimulus packages were enacted. Hitherto-considered unconventional policy measures like quantitative easing suddenly became part of everyone’s daily lexicon.
The extraordinary measures taken in the wake of the GFC had profound effects on our economies, and our lives, in the years that followed. They defined the course of the 11-year economic cycle that ensued, one which had a number of defining attributes which I believe have important implications for the current state of the markets and their potential future path.
In particular, I believe there are three worth highlighting.
The Collapse in Interest Rates
One of the most fundamental concepts in Finance is that of the risk free rate of return. Simply explained, the risk free rate rate is the theoretical rate of return generated by an investment that bears no risk at all. The risk free rate is of vital importance to financial markets and activity. For one, it acts as a benchmark for the return requirements for all other investments, a “hurdle rate” if you will. Any investment bearing risk would need to compensate the investor with an amount in excess to the risk free rate, depending on the level of risk in question. The higher the risk, the higher the differential (or “spread”) between the returns on offer and the risk free rate. In summary, all investments across all asset classes are in some form priced relative to the risk free rate.
Another way in which the risk free rate plays a crucial role in financial theory relates to the practice of Valuation. Valuation is the process of determining the value of a financial instrument. There are several methods for doing this, but one of the most important ones involves discounting future cash flows or income streams to their Present Value. The choice of which discount rate to use has been the subject of many PhDs and even Nobel prizes, but all methods in some way revolve around the risk free rate of return.
Unfortunately, truly risk free rates do not exist. At least, I am not aware of any – if any readers are, I would be most grateful for the tip. However, the general consensus is that the closest we can get to a risk free rate is the return generated by government debt. The thinking being that the risk of default of the government is next to none (or in fact zero, but that is a discussion for another day). Of course governments do default, and have done so many times throughout history, which is why not all government debt is considered risk free. In fact, generally speaking the market considers the debt issued by only a few of the most developed (and theoretically solid) economies as risk free. This includes countries in the Euro-zone, the UK, and Japan.
But more than any other country, the United States is the country whose debt has become the absolute reference for the global financial markets. “Treasuries” as they’re called, are backed, as per the constitution, by the “full faith and credit” of the United States government, meaning that the U.S. government promises to raise money by any legally available means to repay them. Given the dominance of the U.S. both politically and economically for the last century, Treasuries have been “crowned” as the benchmark government debt instrument for the purposes of gauging the risk free rate.
The United States government issues three main types of marketable securities, distinguishable primarily by their length to repayment (their “maturity”): Treasury Bills that mature in less than one year, Treasury Notes that have maturities of two, three, five, seven, and ten years, and Treasury Bonds that have maturities of 30 years. Each of these act as the risk free reference for investments that have similar maturities. In other words, very short term loans will be priced relative to Treasury Bills, whilst longer term debt and other investments will be priced off of the relevant Treasury Note (or Bond if they are particularly long-dated). The most widely cited and tracked of the bunch is arguably the ten-year treasury since a host of important debt instruments like mortgages are priced off of it.
Having established how vitally important the interest rates of U.S. Treasury debt are to the financial markets, we can finally turn to what has unquestionably been one of the most significant and meaningful trends of the last decade. Consider the charts in Exhibit 1 below. Chart 1 charts the interest rates for a few of the more important treasury instruments as far back as the data allows. Chart 3 shows the same data but zooms in on the years since the GFC. Chart 2 instead shows yields2 for the 10-year Treasury (which as discussed above is the most widely referenced U.S. government debt instrument), using the work of Robert Shiller, the Nobel laureate economist at Yale University who has reconstructed the data back to 1871. This is, as far as I am aware, the longest data series on Treasury rates available, and provides for a more holistic historical comparison. Finally, Chart 4 shows yields of the benchmark government bonds for several of the world’s major economies.
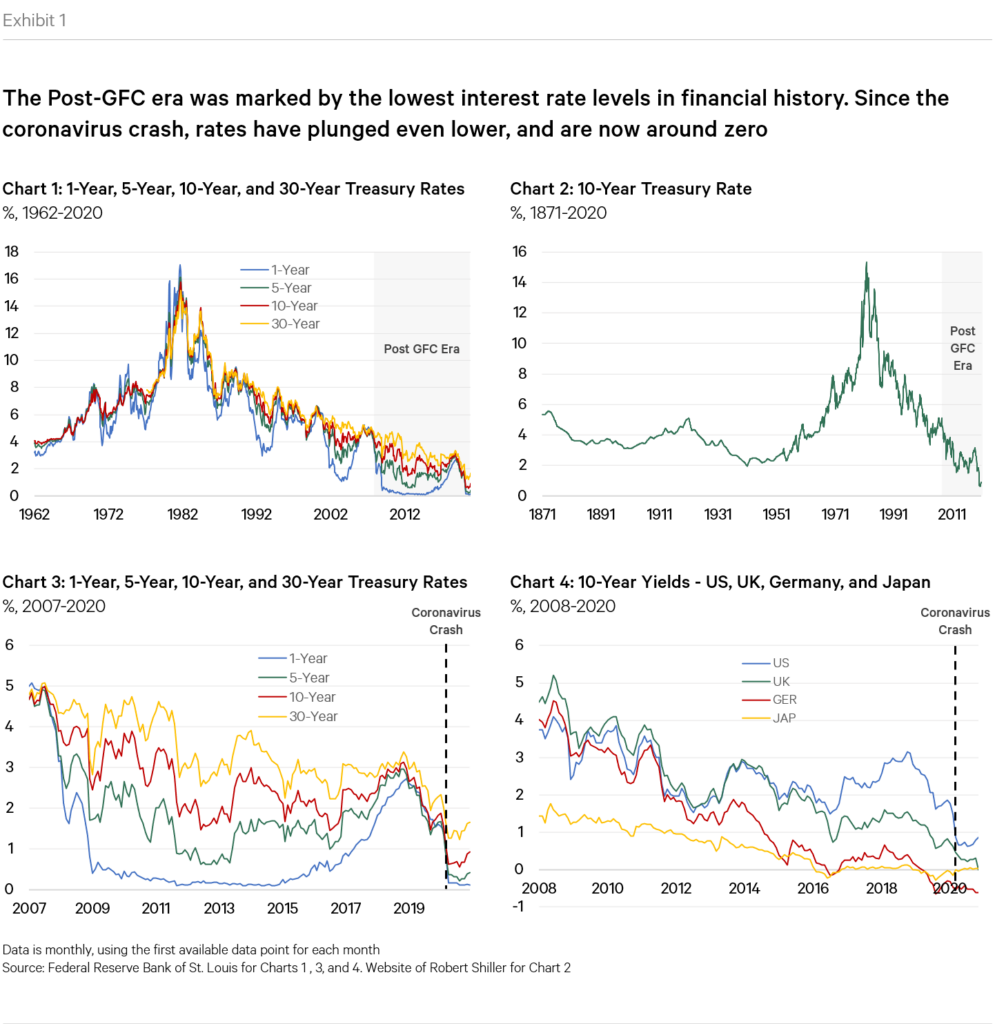
A few startling observations can be made. Looking at Chart 1, one can immediately observe how the interest rates on U.S. government debt in the decade that followed the GFC have been exceptionally low, lower than any other period in the time series. Rates for the shorter maturity instruments (3-month and 1-year) have barely hovered above zero for the majority of the decade. In fact, as Chart 2 also confirms, since the GFC rates have been the lowest they have ever been in all of recorded history.
Turning to Chart 3, perhaps more startling is that fact that after a brief, and in any case limited upward trend from 2016 onwards, the outbreak of the coronavirus crisis in early 2020 sent rates tumbling right back down to levels that are even lower than the prior years. In fact, in March 2020 the 10-year Treasury yield dropped below 1% for the first time ever. As John Authers of Bloomberg put it: “Many momentous events have shaken the U.S. since Ulysses S. Grant’s presidency, but none of them were sufficient to drive long-term money down to such [low] levels.”
As we discussed earlier in the section, U.S. rates are the global benchmark, but what about in other major economies? It turns out the picture is even more pronounced. As per Chart 4, yields on UK, German, and Japanese government debt have for the most part (with the exception of the UK at the beginning of the decade) been even lower than U.S. yields since the GFC, and have collapsed to new lows in 2020 much like those in the U.S. Japanese yields have been particularly low, and together with German yields have been negative for roughly the past two years. Negative yields means that one loses money over the lifetime of the investment. German yields are, at time of writing, as low as -0.58%. If we factor in inflation, real yields are even lower.
To summarize, the decade that ensued following the GFC has been one characterised by unprecedentedly low interest rates across the developed world. Since the outbreak of the coronavirus they have tumbled even further, to levels that we have never witnessed in all of human history (as far back as we have data). It’s hard to overstate the significance of all this. We are for all intents and purposes in uncharted territory.
When such historic and extreme occurrences unfold, there are bound to be equally surprising second order effects. That is precisely what happened.
The Hunt for Yield
At the beginning of the last section I introduced the concept of the risk free rate, outlining how it drives pricing, at least to a certain degree, of all financial instruments. So what have been the effects of the historically low level of interest rates witnessed over the last decade? Here we come to what I consider the second major legacy of the post-GFC period, what has been often referred to as “the hunt for yield”.
The hunt for yield, simply explained, refers to the fact that, faced with unprecedentedly low interest rates, investors have piled money into riskier, higher-yielding assets in order to obtain the types of returns required. To illustrate the concept, consider a typical pension fund which in the U.S. targets returns in the region of 7-8% (in Europe these targets are lower at around 5%). A 2016 paper by Callan Associates referenced in this article, found that, “[whereas] in 1995, a portfolio made up wholly of bonds would return 7.5% a year with a likelihood that returns could vary by about 6%…To make a 7.5% return in 2015…investors needed to spread money across risky assets, shrinking bonds to just 12% of the portfolio. Private equity and stocks needed to take up some three-quarters of the entire investment pool. But with the added risk, returns could vary by more than 17%.”
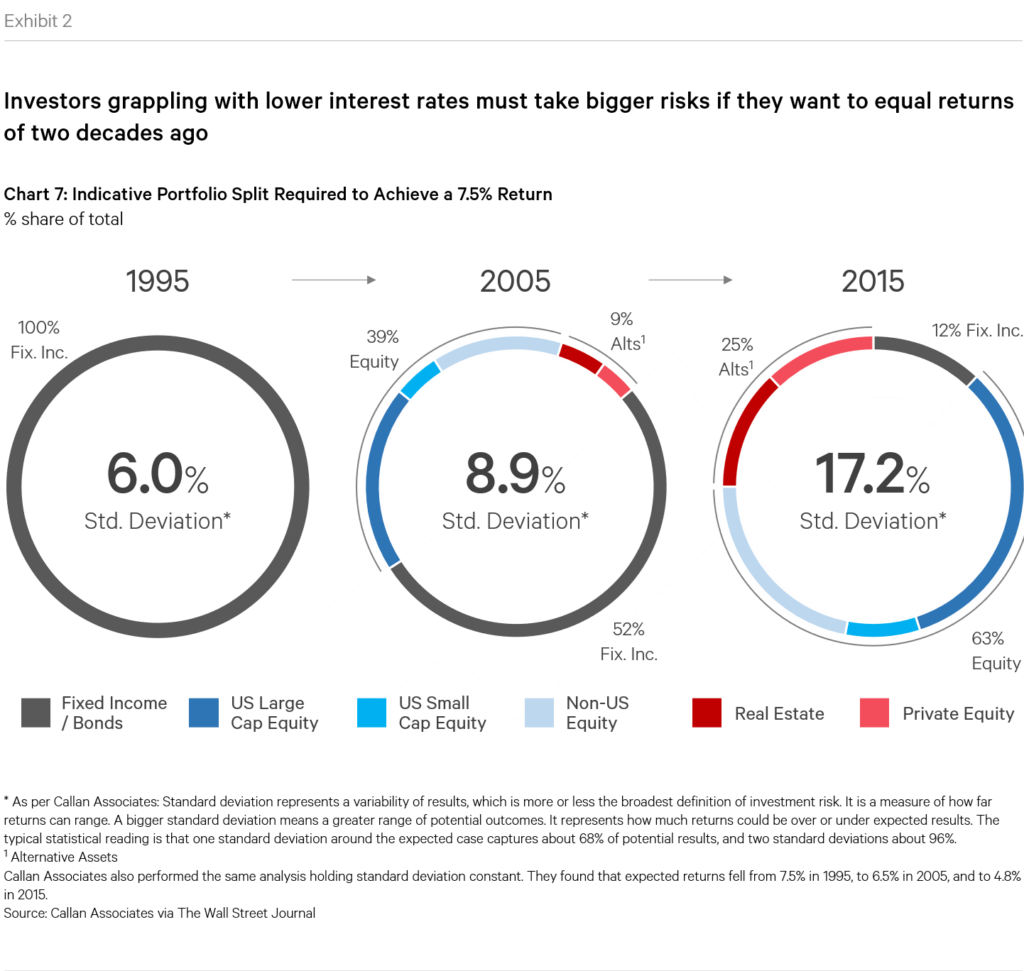
To be clear, in a follow up note Callan clarified that the splits referenced in the analysis were for illustrative purposes and did not reflect what pension funds have actually been doing. But whilst precise data on real allocation splits are hard to find, the general trend towards riskier asset classes has been evident for years. Let’s look at some examples.
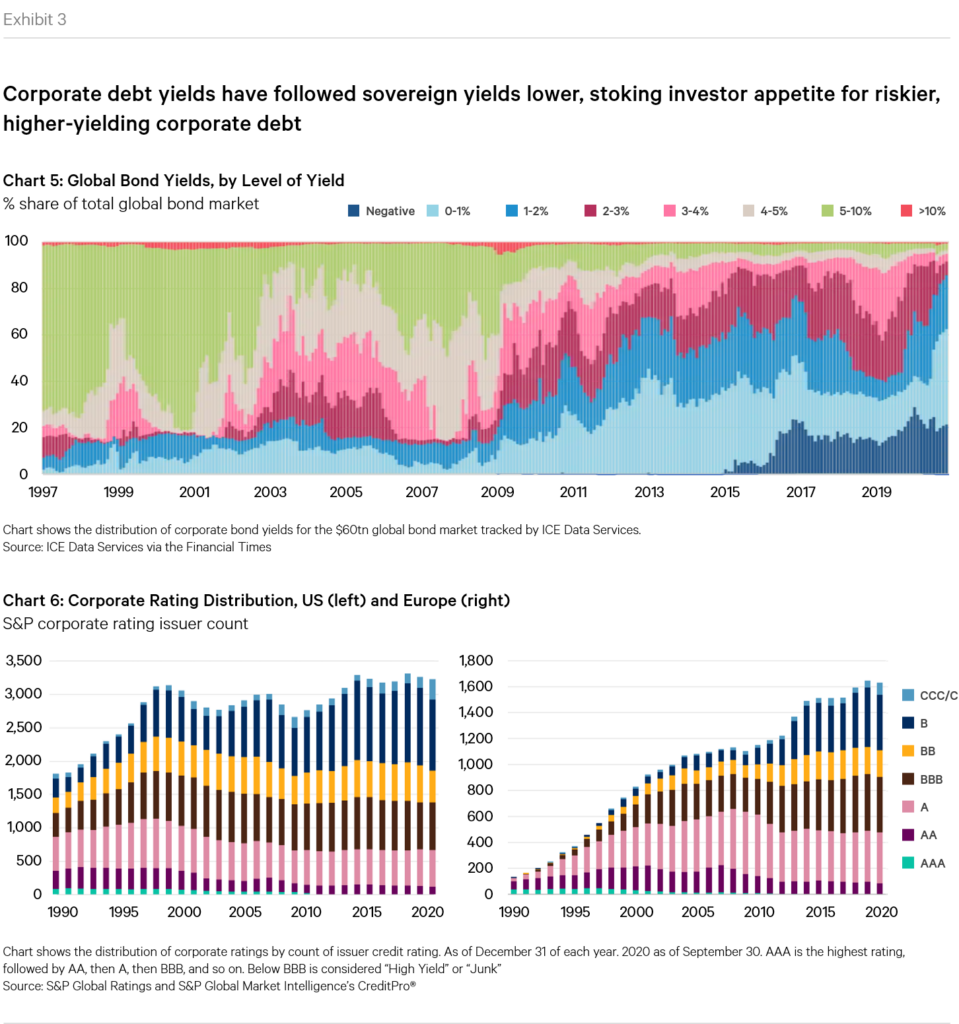
Corporate Debt. The historically low rates of the post GFC era have caused a repricing of riskier debt instruments, such as corporate bonds, to levels hitherto unseen. A recent article outlined how “[as of June 30th 2020] roughly 86 per cent of the $60tn global bond market…traded with yields no higher than 2 per cent — a record proportion — with more than 60 per cent of the market yielding less than 1 per cent as of June 30… Just 3 per cent of the investable bond world today yields more than 5 per cent — a share that is close to an all-time low, and represents a precipitous drop from levels seen roughly two decades ago.”
The historically low rates have in turn created a rush of global debt issuance, as companies and governments have looked to take advantage of the historically low costs and the insatiable appetite for yield. As per a recent OECD report, by the end of 2019 the global outstanding stock of non-financial corporate bonds reached an all-time high of $13.5 trillion in real terms, more than twice the amount outstanding in December 208. The average annual increase since 2008 has stood at $1.8 trillion, double the annual average between 2000 and 2007. If we add bank debt, another UNCTAD report shows how global indebtedness stood at $75 trillion in 2019, up from $45 trillion in 2008 (a 66% increase).
Perhaps more importantly, the glut of debt issuance has also been accompanied by a general move towards lower-rated (in other words riskier) companies. As the OECD report highlights, around 20% of the total amount of all bond issues since 2010 has been non-investment grade and in 2019 the portion reached 25%. This is the longest period since 1980. In 2019,
the portion of BBB rated bonds – the lowest quality of bonds that enjoy investment grade status – accounted for 51% of all investment grade issuance. During the period 2000-2007, the portion was just 39%.
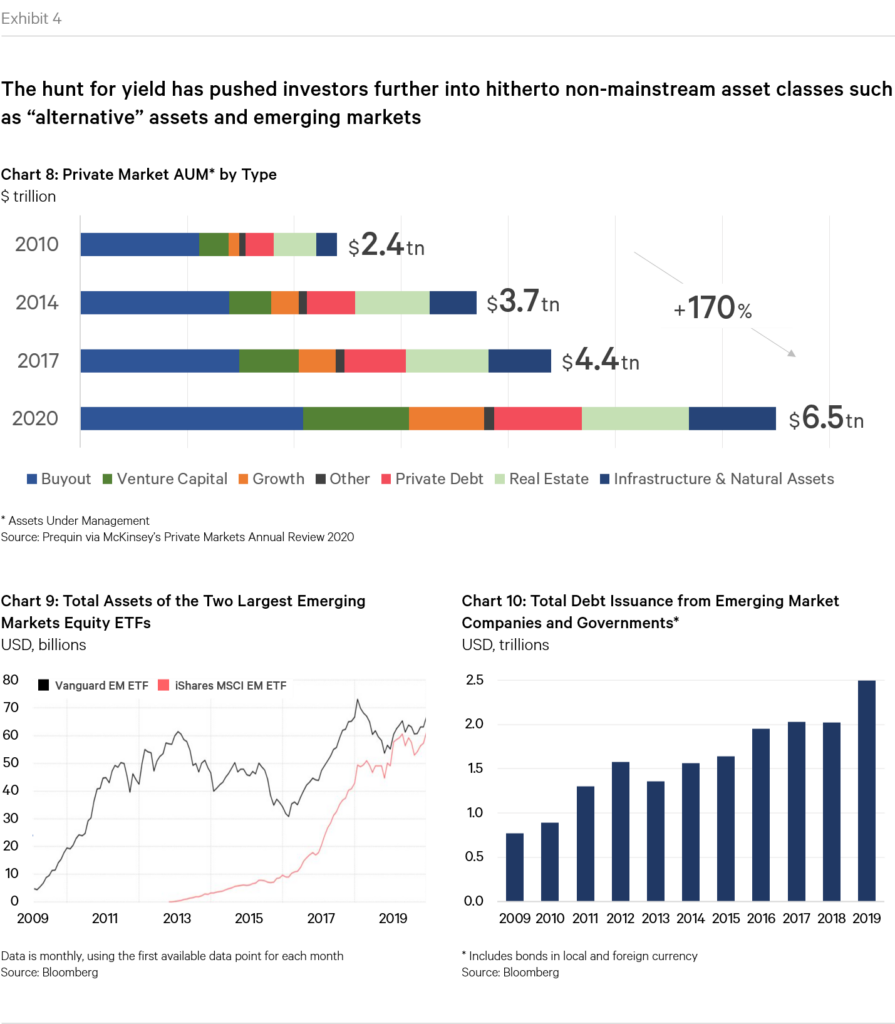
Alternative assets. Moving beyond the debt markets, by far one of the biggest winners of the hunt for yield of the post-GFC era has been the so-called “alternative” asset class space. This bucket tends to include things like private equity, venture capital, real estate, commodities, etc. Over the last decade, alternative assets have seen huge inflows. McKinsey’s Private Markets Annual Review highlights how private market assets under management (“AUM”) have grown by $4tn in the last decade, an increase of 170% (over the same period, global public market AUM has increased 100%). In terms of portfolio allocations, a recent paper by Richard Ennis shows that endowment funds’ allocations to alternative assets has grown from 12% in 1990 to a whopping 58% in 2019. In an article citing his work, the same figure for U.S. public pension funds is said to be 28% (in line with the Callan Associates study referenced earlier).
Emerging markets. Another area that has seen significant inflows has been the broader emerging markets world. A recent Bloomberg article cited how, in large part driven by China, “the share capitalization of developing nations almost doubled, bond issuance tripled and trading in their currencies rose to more than a quarter of the global total”.
The above are only some select examples of the effects of the hunt for yield. The phenomenon has been so broad-brushed that we could have included many other examples, not least headline-grabbing ones like Bitcoin. But attentive readers may have noticed one important omission: equities. This was intentional. Because whilst it is no surprise that the hunt for yield also engulfed equity markets, the extent of the bull market3 we witnessed in the 11 years leading up to the coronavirus crash was exceptional, so much so that it deserved to be singled out as a third defining trend of the post-GFC era.
The Longest Equity Bull Run in History
“I’m not sure what inning we’re in but the key for investors is to stay in the market. You should be 100% in equities” – Larry Fink, Chairman of Blackrock (world’s largest asset manager with $7.81 trillion of assets under management). Interview with CNBC, April 2018.
I vividly remember the day that Lehman Brothers declared bankruptcy. The whole office was huddled around the tv screens nervously watching the events that were unfolding. A few blocks away from my office in Canary Wharf, Lehman employees were packing their belongings in boxes and leaving the office, for good. One of my closer friends who worked there was photographed whilst doing so, and his picture is still often used in news articles referencing the Lehman collapse.
At the time, we were all really scared. We had no idea what would happen. The world was collapsing and it was hard to be positive. But history teaches us that financial crises come and go, and that stock market crashes, however frightening they may be, eventually end and the stock market recovers. This time was no different.
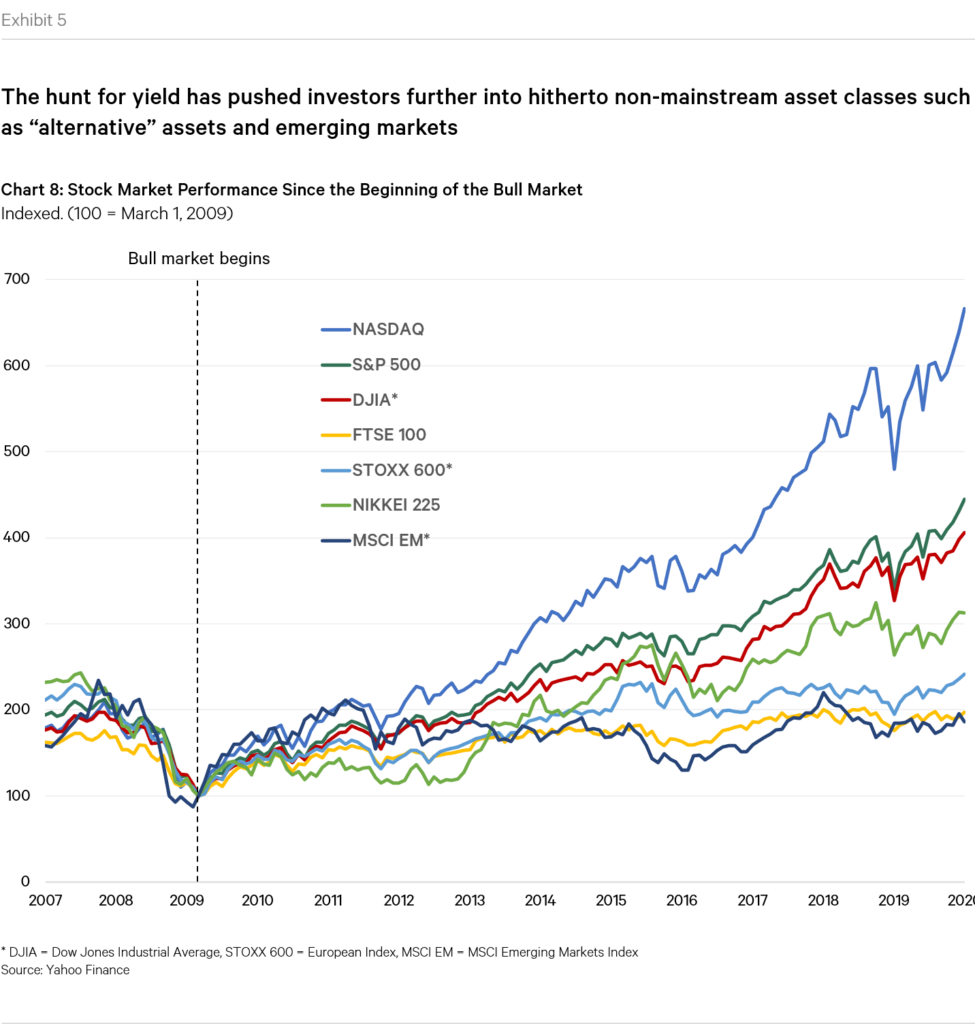
But boy did it recover. From the wreckage of the GFC, the U.S. stock market emerged to embark on what was to become the longest bull run in financial market history, posting 11 years of almost unprecedented gains. Between the trough in March 2009 and the peak in February 2020, the S&P 500 grew around 4.5 times, from 757 to 3380. The Dow Jones Industrial Average went from 7,224 points in March 2009 to 28,824 in January 2020, nearly quadrupling. But the outstanding winner was no doubt the Nasdaq Composite, which in 11 years grew a mouth-dropping 636%.
To be clear, as the chart below shows, this was not a U.S.-only affair. But the U.S. was the undisputable winner of the post-GFC equity race, only the Nikkei remaining in its slipstream.
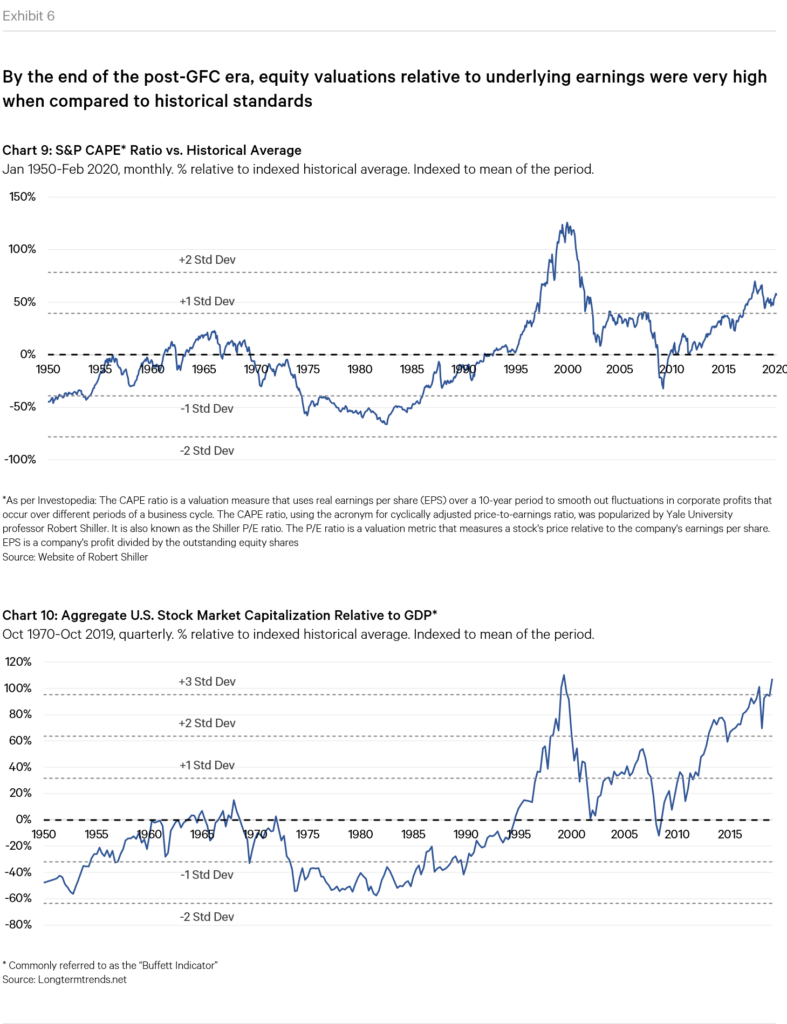
Was this growth accompanied by underlying growth in earnings? After all, stock prices should reflect expectations of future income. If earnings are strong and getting stronger, a phenomenal bull run like the one witnessed would be justified. What matters isn’t so much the price itself, but the price relative to the underlying level of earnings.
The two charts below display the Price-to-Earnings ratio of the S&P 500 for the post-GFC period, as well as the ratio of total U.S. stock market capitalization to GDP (often referred to as “The Buffet Indicator” given it’s favoured use by famed investor Warren Buffett). What do they tell us? I think the picture is quite clear. For the first part of the post-GFC era, the growth in prices was reasonable, with the ratios roughly back to historical averages. But the latter part of the period was less so, with both measures approaching levels that were well beyond trendline and similar to prior periods in which crashes occurred.
Unsurprisingly, over the last few years many have been warning about the frothy levels of the stock markets. Already back in August 2017, Moody’s chief economist Mark Zandi noted that:
“Investors have enjoyed an amazing run. Stock prices are up by nearly a third over the past 18 months and seem to be hitting new record highs daily. And the run-up has been almost a straight line, with stock price volatility…the lowest it has ever been. So why am I pessimistic? The stock market is overvalued. That is, stock prices are much too high despite the good outlook for corporate earnings. The only other time in the past half century that stock prices have been so highly priced was during the tech bubble. Yes, they’re even more overpriced now than prior to the 1987 market crash.”
A few months later in 2018, John Authers of the FT again questioned the valuations:
“The cyclically adjusted price/earnings multiple used to do a great job of signalling when the US stock market was excessively cheap or expensive…At present, it suggests very clearly that US stocks are too expensive, and at its latest reading, last week, passed a very ominous landmark. The benchmark calculation for the indicator, kept by the Yale University Nobel laureate economist Robert Shiller, compares share prices to the average of real earnings over the previous 10 years, and now shows that the US stock market is even higher than it was on the eve of the Great Crash of 1929. Only the last two years of the dotcom bubble have seen comparable overvaluations.”
A year later, on the back of a whopping 29% growth in stock prices in 2019, bubble doubts continued to grow stronger:
“Stock gains have lapped corporate profit growth during the roaring 2019 rally, but few portfolio managers are entering the new year concerned about investor exuberance. The S&P 500’s 29% rise for the year, on track for the best showing since 2013, stands out in part because corporate earnings have contributed a modest 0.4% to the climb. Rising earnings are typically the most dependable fuel for sustained stock-price gains, so the sight of major indexes climbing to records while profits shuffle behind often stokes concern about the risks of runaway sentiment, as seen in the 2000 dot-com bust.”
Perhaps ominously, as recently as January of this year, with the S&P 500, Nasdaq, and Russell 2000 all breaking new records, the New York Times remarked:
“Stocks rose to another record on Thursday as solid corporate earnings and the easing of trade war tensions added to Wall Street’s strong start in 2020. The S&P 500, the Nasdaq composite and the Russell 2000 indexes all ended the day in record territory…The sunny optimism of the stock market may seem surprising in the context of widespread political turbulence in the United States and around the world. On Thursday, the Senate formally opened the impeachment trial of President Trump. And just a couple of weeks ago, outright war between the United States and Iran seemed a distinct possibility. But from the perspective of investors, the forecast looks downright balmy.”
But despite the warnings, the stock market just kept on rising, unphased by any negative occurrences in the world around it. And twe had our fair share during the period: the European sovereign debt crisis, Brexit, Japan’s catastrophic tsunami and earthquake, the US-China trade war, plunges in oil prices, increasing social tensions around the world, and much more. But the upward march was relentless.
The End of an Era
“What goes up must come down” goes the old adage. So after years of head scratching related not just to stock market valuations, but valuations across just about every asset class, the show was bound to come to an end at some point. And it did, in spectacular fashion.
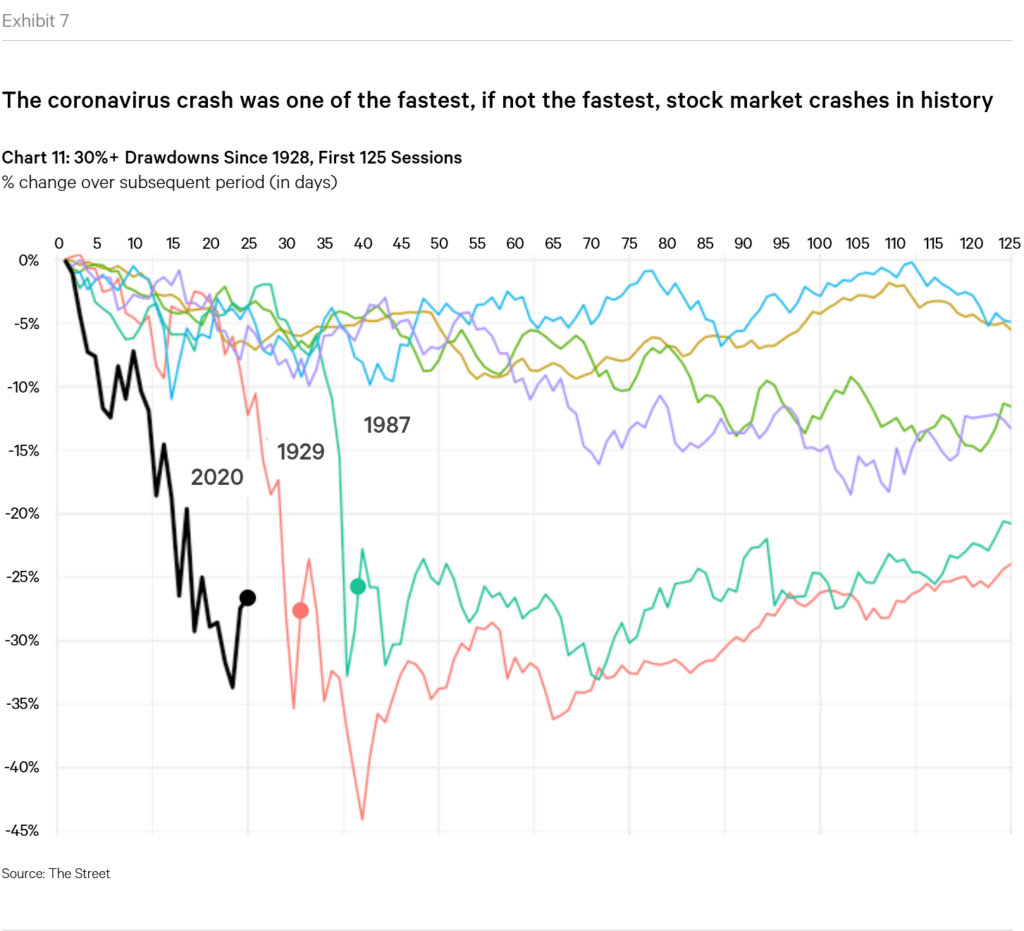
In February 2020, as the effects of the Coronavirus started to rock the world, the equity markets began what became the fastest crash in financial market history. Between February 20th and March 23rd, the Dow Jones Industrial average fell 10,628 points, or 36%. In the same period, the FTSE dropped 33%, the Nikkei 29%, and Euronext 30%.
But the crash wasn’t contained to the equity markets. As lockdowns began to be put into effect around the world and economic activity ground to an unprecedented halt, the price of oil went into meltdown, losing nearly 70% in value, with storage capacity approaching its limits. Even more astonishingly, in April the price of futures contracts for West Texas Intermediate crude went negative for the first time in history.
Turning to bond markets, corporate bond markets precipitated, with high yield spreads ballooning out to rates four times as high as those witnessed before the crash and prices for bond exchange-traded funds dropping below their net asset values. Government bond markets instead witnessed a series of strange and incomprehensible moves such as prices falling (when typically they should rise in periods of stress since they are considered safe-haven assets), prompting some market participants to claim that investors were force-selling for liquidity concerns. The Fed would later go on to implement a series of unprecedented measures to “address highly unusual disruptions in Treasury financing markets associated with the coronavirus outbreak” including direct purchases of Treasury bonds and even corporate bonds, a hitherto unprecedented event.
It’s hard to put into words the tension and anxiety that was in the air during those horrible weeks. I found a CNBC news clip that helps portray it. It’s for the opening of trading on March 9th, later dubbed Black Monday I, which ended with the Dow Jones Industrial Average posting a 7.79% drop, the 13th largest single day drop in history. It would later be topped by Black Thursday (March 12th) in which the index fell 9.99% (5th largest single day drop in history) and eventually by Black Monday II (March 16th) in which it fell 12.93% (2nd largest single day drop in history). I can’t help but highlight journalist Becky Quick’s tragicomic remark: “This is some massive pressure. If you haven’t looked at your 401k over the last couple weeks I wouldn’t recommend doing it today”.
***
“The more you know about the past, the better prepared you are for the future” – Theodore Roosevelt
The post-GFC era was one like no other: the longest equity bull market on record, the mainstreaming of the alternative asset class space, unprecedented levels of government and corporate debt all linked to a desperate hunt for yield and risk appetite which we haven’t seen in generations, perhaps ever. And simmering beneath the surface of all this, the lowest level of interest rates ever witnessed in human history.
This year’s spectacular crash may well seem like a fitting end to the story, but in fact, it’s where it begins. In my short 16 year career I have already lived through two major, history-book setting financial shocks, but the aftermath of this latest crisis has been baffling. I cannot help but think that the legacies of the previous crisis are of paramount importance.
_________________________________
1 In fairness, I think there were some legitimate reasons for why I never invested my money. Firstly, it’s not like I had, or have, significant amounts of savings. Secondly, given my current and former professional endeavor, I valued the liquidity and safety net of holding cash. Finally, I always believed that investing was something that had to be taken seriously, with thought and effort put into it. And since, again for professional reasons, I haven’t had much time on my hands in the last few years I have always put the task off to a later date.
2 Yields differ from interest rates in that they capture the total return generated from an investment, as opposed to only the interest rate. Therefore, they include the effect of pricing at entry. If a bond is bought below its face value, the yield is higher than the interest rate alone. For government bonds, particularly those of the countries primarily analyzed in this post, yields and interest rates do not differ considerably.
3 As per Investopedia: A bull market is the condition of a financial market in which prices are rising or are expected to rise. The term “bull market” is most often used to refer to the stock market but can be applied to anything that is traded, such as bonds, real estate, currencies and commodities. Because prices of securities rise and fall essentially continuously during trading, the term “bull market” is typically reserved for extended periods in which a large portion of security prices are rising. Bull markets tend to last for months or even years.